

This article is part of a sponsored series by Cotality.
2018 was another catastrophic year for wildfires across the United States. Nearly 9 million acres burned, and many lives, homes and businesses were lost. California alone had over 1.8 million acres burned, and the Camp fire was the deadliest and most destructive wildfire in the state’s history. CoreLogic estimates the losses from the Camp Fire total $9.3 billion, as it destroyed nearly 19,000 structures.
While the California wildfire events of 2018 caused more damage compared to the previous year, the risk profiles of the fires were significantly different. In 2017, the extreme wind conditions led to urban conflagration, and many traditionally low risk structures were damaged when strong winds blew the fires from structure to structure. Nearly 97 percent of all single-family residences (SFRs) damaged in the three large fires of 2018 were high or extreme Risk, compared to only 36% in 2017. In both years, we show that as the wildfire risk level increases, the chance of property damage increases as well. For the 2018 fires, we show that lower risk structures were rarely affected; that most of the damage came from locations with high to extreme risk.
Combined Impact of the 2018 Wildfires
When we look at the results relative to SFRs for the three largest fires of 2018, the Camp fire damaged or destroyed 14,062 structures, the Carr fire impacted 1,263 and the Woolsey fire affected 724; combined over 16,000 structures were damaged or destroyed by these fires. To demonstrate the model’s performance, we compare the distribution of risk for the affected SFRs along with the distribution of risk for the populations of SFRs in the proximity of the fires (using the total population of all SFRs in the zip codes affected). The combined analysis provides a good snapshot of how well the scientific risk assessments performed.
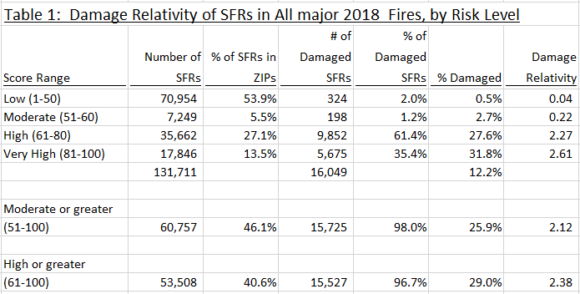
In Table 1 below, 70,954 (53.9%) of the total SFRs in the affected ZIP codes were classified as low risk. However, only 324 of the 16,049 damaged SFRs (2.0%) were in the low risk category. This means that only 0.5 % of all low risk SFRs were damaged by the fires. By comparison, 60,757 structures (46.1%) were classified as moderate, high, or extreme risk, while 15,725 of the 16,049 damaged SFRs (98.0%) were in those higher risk categories; 25.9% of moderate, high or extreme risks in the affected zip codes were damaged in these fires. In other words, structures with moderate or higher risk were 56.7 times more likely to be damaged in the 2018 fires, compared those in low risk locations.
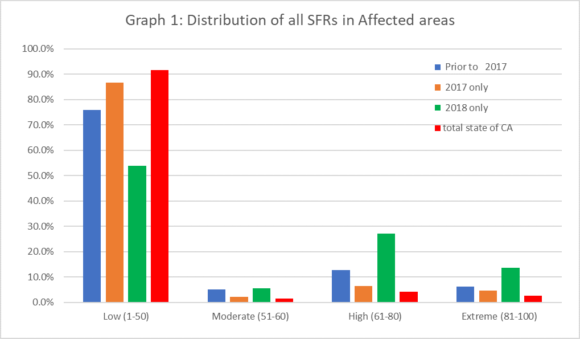
It’s helpful to compare these results to prior California wildfire events. Graph 1 below looks at the risk distribution of SFRs in proximity to California wildfire events over recent years to the entire state. You’ll notice that there were fewer low risk SFRs in affected areas in 2018, compared to prior years. As mentioned earlier, only 53.9% of the SFRs in the 2018 affected areas were low risk, compared to 86.8% in 2017 and 75.8% in events prior to 2017. In the entire state, 91.7% of the SFRs are classified as having low wildfire risk. Also shown is the larger percentage of high and extreme risk in the 2018 affected areas.
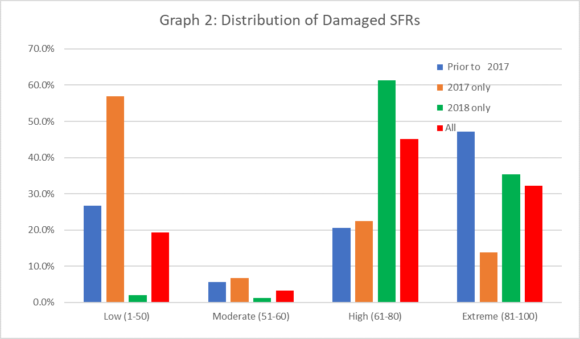
Also, when we compare the risk distribution of SFRs damaged in the events in California (Graph 2), we can see how different the distribution of damage was between the 2017 and 2018 fires, along with prior years.
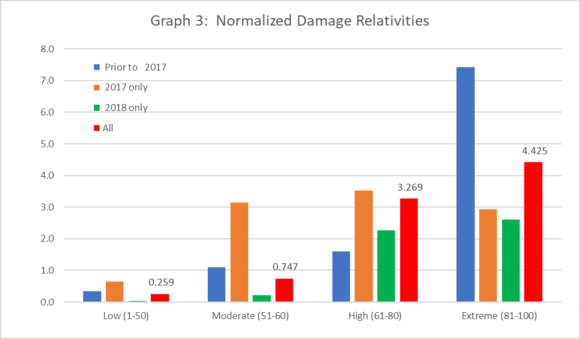
However, given how different the distributions were, the normalized damage ratios (percent of available SFRs that were damaged in the risk group compared to the total percentage damaged for each event) for the various years are similar. In other words, the relative damage ratios for low risk locations are less than average for all year groupings (all years combined is 0.259), and we see the damage ratio generally increase as the risk level increases as displayed in Graph 3.
Summary:
The last few years have seen tremendous amounts of loss from wildfire events. Even though the profiles of 2017 and 2018 events were very different, we can show that the CoreLogic Wildfire Risk Score model works as intended; that lower risk locations have a much lower frequency of damage compared to higher risk locations. And as the risk score increases, the relative chance of damage increases as well.
Was this article valuable?
Here are more articles you may enjoy.
 The $3 Trillion AI Data Center Build-Out Becomes All-Consuming for Debt Markets
  Allstate CEO Wilson Takes on Affordability Issue During Earnings Call
  Beazley Agrees to Zurich’s Sweetened £8 Billion Takeover Bid
  Winter Storm Fern to Cause Up to $6.7B in Insured Losses