The 2001 premium and loss data for Texas verifies everything you heard from the insurance companies — it was a really bad year. Here are the highlights in review:
• Texas accounts for 7 percent of the national premium volume, unchanged from 2000.
• The aggregate loss ratio for all Texas companies for all lines of business is 96.9 percent (up from 78.5 percent in 2000), compared to the national loss ratio of 79.3 percent (up from 71.3
percent in 2000). This is the second year in a row that the Texas loss ratio has exceeded the national loss ratio since 1995.
• Texas independent agencies lost ground in the annual battle for personal lines market share. The 23.2 percent market share in auto and homeowners combined in the lowest percentage since IIAT began publishing this market share analysis in 1990. The highest percentage ever recorded during that time was 29.5 percent in 1990. Texas independent agencies in 2001 captured only 17.3 percent of the homeowners market and 25.3 percent of the personal auto market.
• In homeowners, loss ratios are just as advertised. Companies paid out almost $116 in claims for every $100 they collected in premium.
• Loss ratios in commercial multi-peril were down a little from 2000, but still unprofitable.
• In commercial auto, loss ratios went down (still unprofitable), while the total written premium went up more than 20 percent.
• After 5 years of loss ratios that were marginally unprofitable, the workers’ compensation loss ratios went out of control in 2001, to almost 90 percent.
This special report includes a line-by-line analysis of the Texas premium, loss and market share data for 2001.
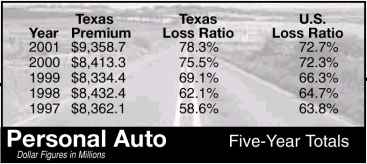
PERSONAL AUTO
The personal auto loss ratio has been going up since 1997 and seems to be unable to return to a profitable level. With the homeowners line in a state of crisis, it looks like personal lines is something the agency companies will be trying to avoid for a while. The Texas loss ratio is higher than the national loss ratio for the second year in a row now. Independent agents lost market share in personal auto.
There was no change in the top 20 carriers in personal auto, and just a little shuffling of position within the top 20.
County mutual insurance companies increased their market share to 28.2 percent, compared to 26.7 percent in 2000 with a premium volume of $2.6 billion.
|
TOP 20 Personal Auto Carroes in Texas—2001
|
|
’01
Rank
|
Co. Name |
’00 Rank
|
Total Premium*
|
Mkt. Share
|
Loss Ratio
|
|
1
|
State Farm |
1
|
2,183.5
|
23.3%
|
81.8%
|
|
2
|
Allstate |
2
|
1,562.6
|
16.7%
|
77.4%
|
|
3
|
Zurich/Farmers |
3
|
1,212.3
|
13.0%
|
77.2%
|
|
4
|
USAA |
4
|
583.4
|
6.2%
|
84.4%
|
|
5
|
Progressive |
5
|
487.9
|
5.2%
|
57.6%
|
|
6
|
Nationwide |
7
|
366.3
|
3.9%
|
84.7%
|
|
7
|
State National |
8
|
333.1
|
3.6%
|
65.5%
|
|
8
|
Berkshire Hathaway (GEICO) |
6
|
323.0
|
3.5%
|
81.7%
|
|
9
|
Farm Bureau |
9
|
268.0
|
2.9%
|
87.2%
|
|
10
|
Home State |
10
|
218.6
|
2.3%
|
67.9%
|
|
11
|
Old American |
11
|
184.1
|
2.0%
|
64.4%
|
|
12
|
Travelers |
12
|
154.3
|
1.6%
|
80.9%
|
|
13
|
Unitrin |
13
|
153.3
|
1.6%
|
80.5%
|
|
14
|
SAFECO |
15
|
111.0
|
1.2%
|
65.9%
|
|
15
|
Winterthur Swiss |
17
|
96.8
|
1.0%
|
58.3%
|
|
16
|
Hartford |
16
|
90.8
|
1.0%
|
74.0%
|
|
17
|
Liberty Mutual |
19
|
79.3
|
0.8%
|
81.0%
|
|
18
|
Sentry |
18
|
65.0
|
0.7%
|
57.5%
|
|
19
|
CNA |
20
|
59.7
|
0.6%
|
192.3%
|
|
20
|
Titus |
14
|
59.5
|
0.6%
|
74.1%
|
| *Dollar figures in millions; Texas totals only |
|

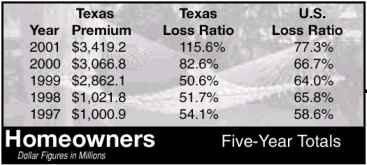
HOMEOWNERS
The homeowners line is a disaster. The loss ratio jumped from 82.6 percent in 2000 to 115.6 percent in 2001. The Texas loss ratio is 38 points higher than the national average. Hartford was the only company in the top 20 to post a profitable loss ratio—60.9 percent.
Despite the moratoriums implemented by many direct writers during the second half of 2001, market share for the top 20 carriers remained relatively unchanged. CGU and Beacon dropped out, replaced by Service Group and MetLife Auto & Home.
Independent agents didn’t fare any better as a result of the direct writers’ woes — market shares for independent agents dropped to 17.3 percent compared to 17.8 percent in 2000.
|
Top 20 Homeowner Carriers in Texas—2001
|
|
’01 Rank
|
Co. Name |
’00 Rank
|
Total Premium*
|
Mkt. Share
|
Loss Ratio
|
|
1
|
State Farm |
1
|
1,041.7
|
30.5%
|
122.8%
|
|
2
|
Zurich/Farmers |
2
|
656.0
|
19.2%
|
117.6%
|
|
3
|
Allstate |
3
|
571.7
|
16.7%
|
115.7%
|
|
4
|
USAA |
4
|
225.2
|
6.6%
|
83.0%
|
|
5
|
Travelers |
5
|
143.3
|
4.2%
|
110.7%
|
|
6
|
Nationwide |
6
|
100.2
|
2.9%
|
137.6%
|
|
7
|
Chubb |
8
|
67.4
|
2.0%
|
116.4%
|
|
8
|
SAFECO |
7
|
60.1
|
1.8%
|
108.5%
|
|
9
|
Farm Bureau |
9
|
53.4
|
1.6%
|
121.5%
|
|
10
|
Liberty Mutual |
10
|
39.2
|
1.1%
|
123.0%
|
|
11
|
Hartford |
11
|
35.6
|
1.0%
|
60.9%
|
|
12
|
Allianz |
15
|
34.2
|
1.0%
|
187.4%
|
|
13
|
American National |
16
|
31.7
|
0.9%
|
94.7%
|
|
14
|
CNA |
12
|
31.4
|
0.9%
|
127.3%
|
|
15
|
Winterthur Swiss |
14
|
30.3
|
0.9%
|
96.6%
|
|
16
|
Titus |
13
|
30.3
|
0.9%
|
144.1%
|
|
17
|
Unitrin |
17
|
25.9
|
0.8%
|
123.9%
|
|
18
|
Service |
23
|
24.2
|
0.7%
|
86.8%
|
|
19
|
Amica Mutual |
18
|
23.4
|
0.7%
|
116.9%
|
|
20
|
MetLife Auto & Home |
21
|
19.7
|
0.6%
|
87.4%
|
| *Dollar figures in millions; Texas totals only |
|
COMMERCIAL MULTI-PERIL
The commercial multi-peril loss ratio remained unprofitable in 2001, but was one of only two lines that posted a decrease from 2000 — 85.8 percent compared to 87.5 percent in 2000. The national loss ratio for this line increased from 65.3 percent in 2000 to 82 percent in 2001.
The top 20 includes two new carriers. St. Paul improved from 21st to 15th, while GE Global (ERC) moved from 23rd to 19th, replacing last year’s 10th-ranked carrier Fairfax (Ranger) and 13th-ranked ACE-INA. Winterthur Swiss (Republic) came on strong, from 18th to 11th, after entering the commercial lines arena just a couple of years ago. The Zurich/Farmers combo took over first place from Travelers.
|
Top 20 Commercial Multi-Peril Carriers in Texas—2001
|
|
’01 Rank
|
Co. Name |
’00 Rank
|
Total Premium*
|
Mkt. Share
|
Loss Ratio
|
|
1
|
Zurich/Farmers |
2
|
157.7
|
12.1%
|
72.9%
|
|
2
|
Travelers |
1
|
129.0
|
9.9%
|
66.2%
|
|
3
|
CNA |
3
|
110.5
|
8.5%
|
106.4%
|
|
4
|
Hartford |
5
|
71.9
|
5.5%
|
59.7%
|
|
5
|
State Farm |
6
|
59.7
|
4.6%
|
68.3%
|
|
6
|
Chubb |
8
|
55.1
|
4.2%
|
116.4%
|
|
7
|
Allianz |
9
|
48.3
|
3.7%
|
135.1%
|
|
8
|
White Mountains |
4
|
46.3
|
3.5%
|
67.1%
|
|
9
|
SAFECO |
7
|
44.2
|
3.4%
|
58.5%
|
|
10
|
Liberty Mutual |
16
|
38.7
|
3.0%
|
169.0%
|
|
11
|
Winterthur Swiss |
18
|
28.7
|
2.2%
|
80.2%
|
|
12
|
Royal & SunAlliance |
17
|
28.2
|
2.2%
|
49.5%
|
|
13
|
Nationwide |
12
|
26.1
|
2.0%
|
78.8%
|
|
14
|
Kemper |
11
|
25.9
|
2.0%
|
160.8%
|
|
15
|
St. Paul |
21
|
24.4
|
1.9%
|
149.0%
|
|
16
|
GuideOne |
14
|
23.8
|
1.8%
|
80.9%
|
|
17
|
Allstate |
15
|
23.3
|
1.8%
|
71.1%
|
|
18
|
Old Republic |
20
|
22.7
|
1.7%
|
41.9%
|
|
19
|
GE Global |
23
|
21.0
|
1.6%
|
191.9%
|
|
20
|
Church Mutual |
19
|
19.8
|
1.5%
|
64.6%
|
| *Dollar figures in millions; Texas totals only |
|
|
Texas
|
Texas
|
U.S.
|
|
Year
|
Premium
|
Loss Ratio
|
Loss Ratio
|
|
2001
|
$1,304.7
|
85.8%
|
82.0%
|
|
2000
|
$1,094.5
|
87.5%
|
65.3%
|
|
1999
|
$1,017.3
|
66.5%
|
69.7%
|
|
1998
|
$1,021.8
|
51.7%
|
65.8%
|
|
1997
|
$1,000.9
|
54.1%
|
58.6%
|
|
Commercial Multiperil
|
Five-Year Totals
|
| Dollar Dollar Figures in Millions |
|
COMMERCIAL AUTO
Profitability continues to elude commercial auto underwriters for another year, even though a 21 percent increase in written premium for this line contributed to a drop in the loss ratio from 84.3 percent to 79.3 percent.
There always seems to be a stable available market for this line, although it does appear that county mutuals are the ones providing the market. County mutuals increased their market share in commercial auto from 27.5 percent ($379.3 million) in 2000 to 29.9 percent ($497.6 million) in
2001.
Allianz (Fireman’s Fund) and Great American entered the top 20 in 2001, replacing Royal and CGU (combined now with Liberty Mutual at number 20).
|
Top 20 Commercial Auto Carriers in Texas—2001
|
|
’01 Rank
|
Co. Name |
’00 Rank
|
Total Premium*
|
Mkt. Share
|
Loss Ratio
|
|
1
|
Zurich/Farmers |
1
|
145.6
|
8.8%
|
74.8%
|
|
2
|
Winterthur Swiss |
3
|
102.1
|
6.1%
|
70.0%
|
|
3
|
American International |
4
|
100.9
|
6.1%
|
62.7%
|
|
4
|
State National |
2
|
71.4
|
4.3%
|
79.8%
|
|
5
|
Progressive |
9
|
70.9
|
4.3%
|
53.4%
|
|
6
|
CNAChubb |
6
|
64.5
|
3.9%
|
120.2%
|
|
7
|
Travelers/Citigroup |
5
|
63.5
|
3.8%
|
91.9%
|
|
8
|
State Farm |
7
|
57.3
|
3.4%
|
80.6%
|
|
9
|
Allianz |
22
|
55.7
|
3.3%
|
77.7%
|
|
10
|
Allstate |
12
|
53.8
|
3.2%
|
68.6%
|
|
11
|
St. Paul |
13
|
52.0
|
3.1%
|
69.9%
|
|
12
|
Hartford |
11
|
45.9
|
2.8%
|
65.7%
|
|
13
|
Old American |
8
|
45.5
|
2.7%
|
119.8%
|
|
14
|
Unitrin |
14
|
43.4
|
2.6%
|
70.6%
|
|
15
|
Home State |
19
|
42.3
|
2.5%
|
82.9%
|
|
16
|
Nationwide |
17
|
39.5
|
2.4%
|
92.0%
|
|
17
|
Old Republic |
16
|
38.1
|
2.3%
|
93.6%
|
|
18
|
Great American |
23
|
35.5
|
2.1%
|
72.9%
|
|
19
|
SAFECO |
18
|
27.8
|
1.7%
|
58.1%
|
|
20
|
Liberty Mutual |
15
|
27.6
|
1.7%
|
123.2%
|
| *Dollar figures in millions; Texas totals only |
|
|
Texas
|
Texas
|
U.S.
|
|
Year
|
Premium
|
Loss Ratio
|
Loss Ratio
|
|
2001
|
$1,662.8
|
79.3%
|
75.2%
|
|
2000
|
$1,377.9
|
84.3%
|
78.2%
|
|
1999
|
$1,303.4
|
80.8%
|
76.2%
|
|
1998
|
$1,797.3
|
76.9%
|
74.8%
|
|
1997
|
$1,290.2
|
67.3%
|
68.1%
|
|
Commercial Auto
|
Five-Year Totals
|
| DollarDollar Figures in Millions |
|
WORKERS’ COMPENSATION
The party is over in workers’ compensation. After five years of steadily increasing loss ratios from the profitable levels of the early 1990s, the workers’ compensation loss ratio jumped more than 10 points in 2001, from 78.2 percent in 2000 to 89.5 percent in 2001. At least it’s not much worse than the national average loss ratio of 86 percent.
Texas Mutual Insurance Company continues to dominate market share with 17.7 percent of the business (up from 15 percent in 2000) and a loss ratio that’s more than 16 points better than the statewide average.
There was plenty of change in the top 20 carriers from 2000 to 2001, with five carriers out (Allianz, Highlands, SAFECO, Amerisafe, and Fremont) and five carriers in (ACE-INA, Service Group, Atlantic American, Chubb and Amerisure). Service Group is now in the 14th position, thanks in part to IIATmembers’ participation in the Comp Connection program.
|
Top 20 Workers’ Compensation Carriers in Texas—2001
|
|
’01 Rank
|
Co. Name |
’00 Rank
|
Total Premium*
|
Mkt. Share
|
Loss Ratio
|
|
1
|
Texas Mutual |
1
|
421.7
|
17.7%
|
72.9%
|
|
2
|
Zurich/Farmers |
3
|
195.6
|
8.2%
|
94.5%
|
|
3
|
Liberty Mutual |
2
|
176.5
|
7.4%
|
144.7%
|
|
4
|
CNA |
5
|
166.4
|
7.0%
|
76.0%
|
|
5
|
American International |
4
|
140.2
|
5.9%
|
84.7%
|
|
6
|
Kemper |
6
|
118.2
|
5.0%
|
133.9%
|
|
7
|
Hartford |
7
|
103.2
|
4.3%
|
53.8%
|
|
8
|
Royal & SunAlliance |
9
|
87.8
|
3.7%
|
86.8%
|
|
9
|
St. Paul |
10
|
60.4
|
2.5%
|
34.7%
|
|
10
|
Travelers/Citigroup |
8
|
58.5
|
2.5%
|
81.0%
|
|
11
|
ACE INA |
25
|
56.0
|
2.4%
|
42.3%
|
|
12
|
Old Republic |
17
|
45.1
|
1.9%
|
82.1%
|
|
13
|
Swiss Re |
14
|
43.5
|
1.8%
|
100.1%
|
|
14
|
Service |
24
|
41.7
|
1.8%
|
43.5%
|
|
15
|
Fairfax |
13
|
30.1
|
1.3%
|
41.5%
|
|
16
|
Unitrin |
19
|
29.7
|
1.2%
|
89.6%
|
|
17
|
White Mountains |
12
|
28.2
|
1.2%
|
147.5%
|
|
18
|
Atlantic American/Delta |
21
|
28.6
|
1.2%
|
75.4%
|
|
19
|
Chubb |
23
|
28.0
|
1.2%
|
39.2%
|
|
20
|
Amerisure |
31
|
26.3
|
1.1%
|
90.2%
|
| *Dollar figures in millions; Texas totals only |
|
|
Texas
|
Texas
|
U.S.
|
|
Year
|
Premium
|
Loss Ratio
|
Loss Ratio
|
|
2001
|
$2,379.6
|
89.5%
|
86.0%
|
|
2000
|
$2,024.7
|
78.2%
|
84.2%
|
|
1999
|
$1,740.7
|
78.9%
|
81.2%
|
|
1998
|
$1,797.3
|
73.4%
|
72.2%
|
|
1997
|
$1,739.9
|
73.6%
|
62.7%
|
|
Workers’ Compensation
|
Five-Year Totals
|
| Dollar Dollar Figures in Millions |
|
THE 2002 OUTLOOK
Because of mold claims and deteriorating loss ratios, Texas finds itself in the national spotlight for the second year in a row. With eight months of 2002 already behind us, we can almost guarantee this year will not look any better. Coaches always prefer to call the year after two losing seasons the rebuilding year. After two consecutive losing seasons in the Texas insurance business, we’ll be optimistic and declare 2003 the year when it will all turn around. Premiums will be up, loss ratios will be down, and the public will once again have confidence that the insurance industry is anxious to sell a good insurance product for a reasonable price.
|
2001 Top 50 Companies From Group II Line Study
|
|
’01 Rank
|
Co. Name |
’00 Rank
|
Total Premium*
|
’01 Mkt. Share
|
’00 Mkt. Share
|
|
1
|
State Farm |
1
|
3,489.0
|
14.3%
|
14.4%
|
|
2
|
Zurich/Farmers |
2
|
2,835.4
|
11.6%
|
11.4%
|
|
3
|
Allstate |
3
|
2,286.1
|
9.4%
|
9.4%
|
|
4
|
American International |
4
|
946.1
|
3.9%
|
3.9%
|
|
5
|
USAA |
5
|
862.2
|
3.5%
|
3.7%
|
|
6
|
Travelers/Citigroup |
6
|
835.4
|
3.4%
|
3.5%
|
|
7
|
CNA |
9
|
451.3
|
2.5%
|
2.4%
|
|
8
|
Nationwide |
8
|
429.6
|
2.5%
|
2.5%
|
|
9
|
Progressive |
7
|
428.2
|
2.3%
|
2.5%
|
|
10
|
Hartford |
11
|
421.7
|
1.8%
|
1.9%
|
|
11
|
Allianz |
15
|
416.7
|
1.8%
|
1.6%
|
|
12
|
Liberty Mutual |
10
|
401.0
|
1.8%
|
1.4%
|
|
13
|
Texas Mutual |
19
|
391.7
|
1.7%
|
1.4%
|
|
14
|
State National |
14
|
391.0
|
1.7%
|
1.7%
|
|
15
|
Berkshire Hathaway |
12
|
368.7
|
1.6%
|
1.7%
|
|
16
|
Southern Farm Bureau |
13
|
364.6
|
1.6%
|
1.7%
|
|
17
|
Chubb |
16
|
338.2
|
1.6%
|
1.6%
|
|
18
|
St. Paul |
20
|
325.1
|
1.5%
|
1.3%
|
|
19
|
Unitrin |
17
|
320.1
|
1.5%
|
1.6%
|
|
20
|
Kemper |
21
|
299.0
|
1.4%
|
1.3%
|
|
21
|
SAFECO |
18
|
274.9
|
1.3%
|
1.5%
|
|
22
|
Winterthur Swiss |
22
|
261.4
|
1.3%
|
1.2%
|
|
23
|
ACE INA |
27
|
258.9
|
1.2%
|
0.9%
|
|
24
|
Royal & SunAlliance |
26
|
247.1
|
1.1%
|
1.0%
|
|
25
|
Home State |
23
|
173.3
|
1.1%
|
1.1%
|
|
26
|
Great American |
28
|
171.7
|
1.1%
|
0.9%
|
|
27
|
Old American |
25
|
155.1
|
1.0%
|
1.0%
|
|
28
|
Old Republic |
33
|
136.0
|
0.7%
|
0.6%
|
|
29
|
White Mountains |
24
|
126.0
|
0.7%
|
NA
|
|
30
|
Germania Mutual |
31
|
124.3
|
0.6%
|
0.7%
|
|
31
|
GE Global |
32
|
123.3
|
0.6%
|
NA
|
|
32
|
Titus |
29
|
120.5
|
0.5%
|
0.9%
|
|
33
|
Fairfax |
30
|
115.4
|
0.5%
|
0.8%
|
|
34
|
Sentry |
34
|
95.0
|
0.5%
|
0.5%
|
|
35
|
W.R. Berkley |
38
|
93.3
|
0.5%
|
0.3%
|
|
36
|
XL American |
44
|
85.2
|
0.5%
|
0.3%
|
|
37
|
Health Care Indemnity |
38
|
84.7
|
0.4%
|
0.3%
|
|
38
|
FM Global |
40
|
79.0
|
0.4%
|
0.3%
|
|
39
|
HDI US |
79
|
77.0
|
0.4%
|
NA
|
|
40
|
Service |
54
|
76.0
|
0.3%
|
NA
|
|
41
|
American National |
39
|
71.7
|
0.3%
|
0.3%
|
|
42
|
Hochheim Prairie |
41
|
71.3
|
0.3%
|
0.3%
|
|
43
|
Markel |
53
|
70.4
|
0.3%
|
NA
|
|
44
|
MetLife Auto & Home |
48
|
69.5
|
0.3%
|
0.3%
|
|
45
|
United National |
60
|
65.6
|
0.3%
|
NA
|
|
46
|
Legion |
49
|
65.1
|
0.3%
|
0.3%
|
|
47
|
Swiss Re |
43
|
63.3
|
0.3%
|
0.3%
|
|
48
|
Centurion |
37
|
61.3
|
0.3%
|
0.4%
|
|
49
|
National American |
36
|
60.9
|
0.3%
|
0.4%
|
|
50
|
Mortage Guaranty |
45
|
58.6
|
0.3%
|
0.3%
|
| *Dollar figures in millions; Texas totals only |
|
David Surles is the Director of Insurance Programs and Regina Anderson is the Manager of Technical Services for the Independent Insurance Agents of Texas.
Topics
Texas
Carriers
Agencies
Auto
Profit Loss
Workers' Compensation
Personal Auto
Homeowners
Independent Agencies
State Farm

 Longtime Alabama Dentist Charged With Insurance Fraud in 2025 Office Explosion
  Chubb Posts Record Q4 and Full Year P/C Underwriting Income, Combined Ratio
  Zurich Reveals Beazley Stake After UK Insurer Spurns Bid