
Are Your Carriers Positioned For What Comes Next?
For the U.S., property/casualty industry recent events have mimicked the boxing idiom one, two punch. P/C industry professionals haven’t seen a combination of an underwriting cycle and an investment environment quite like this within recent memory. The typical prolonged soft underwriting cycle followed by a much shorter, but very strong hard market has failed to materialize. In fact, the last three soft markets have averaged nine years in length while the last three hard markets have averaged only three years. And, thanks to the Fed’s prolonged stance of low interest rates, the soft cycle has now combined with anemic investment returns adding further strains on operating performance.
Questions of “How long will both last?” and “Is this the ‘new normal’?” are just the tip of the iceberg of growing concerns.
No one can guaranty how the P/C market will perform, leaving carriers to grapple with key issues about how to prepare for the future. Should they cut costs to survive, ride it out, invest in new initiatives to capture market share or look to other options? Do they even know where they stand relative to the industry, competitors or even their own past performance?
Unfortunately, traditional performance measures and metrics available to insurers, which have always had many weaknesses, are especially not useful at times like this. Most insurance executives have become frustrated with traditional performance measures because they are either purely internally oriented or they do not sufficiently differentiate carrier performance from competitors to be useful in understanding their company’s performance and position in the market.
Efficient Frontier Analysis (EFA) helps answer these questions and may be the best tool to do so in such unusual times.
Current Hard Market/Soft Market
Coming out of the Great Recession, many carriers were expecting rates to harden as the economy improved. Historically, as economic activity returns to normal and the economy expands, insurers benefit from high demand and hardening prices. But while rates did firm to a degree, the hard market stalled relatively quickly resulting in renewed rate compression in an already low interest rate environment. As the graph below shows, commercial lines rates have begun to trend downward.
The typical P/C underwriting cycle is composed of a “hard” market lasting from two to three years with increasing rates. As shown in the graph below, it is not unusual for rate increases to range from 15 percent to 30 percent on a year-over-year basis. Hard markets are typically attributed to significant declines of surplus in the industry and/or significant increases in demand for insurance. Both can be tied to a robust expanding economy where capital is being deployed to growing industries driving overall growth and the associated need to insure the new risks created by innovation and the growth (properties, employees, businesses, goods, homes, cars, etc.). Combine this with a significant catastrophic event such as a hurricane or massive earthquake and the formula of supply (capital) and demand for the P/C industry is primed for major price increases.
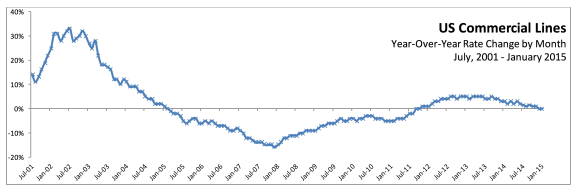
Soft market cycles typically result after the hard market has pushed rates beyond long-term sustainable levels and the high profitability of the industry has attracted more capital seeking superior returns, thus increasing competition. Unfortunately, soft markets tend to last much longer than hard markets, but with less dramatic year-over-year rate changes. Rate declines of 5 percent to 15 percent year-over-year are not uncommon in a soft market.
What is unusual this time around is that despite a prolonged and significant soft market, the hard market failed to fully materialize and be sustainable. Price increases never reached a level sufficient to be considered a truly hard market. In addition, the “firming” market was relatively short lived.
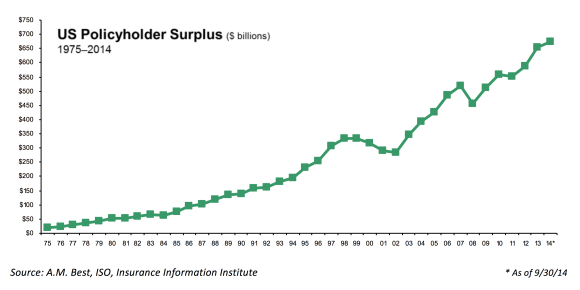
One of the drivers that prevented a sustainable hard market from developing was the extended weak economy that followed the last recession. Most recoveries from recessions in the U.S. are much more rigorous and definitive than what we have seen recently. The dubious nature of any real trending improvements in the economy dampened confidence in the recovery’s sustainability and interest in investing in it on the part of investors and the public. Simultaneously, insurers retained high capital levels (see U.S. Policyholder Surplus graph), particularly in the reinsurance segment. The hope for many insurers had been to quickly capture hard market opportunities through the ability to immediately deploy capital to new opportunities.
A New Approach for Moving Forward
The unusual twist now is that even as the economy continues its slow and unsteady recovery, the P/C market is turning soft. The weight of the industry’s capital is too much for the paltry new demand experienced thus far from the recovery. So at a time of potential threat to the industry, most carriers’ financial strength will look good by most existing measures. Standard ratio analysis will show all companies being negatively impacted by soft market pricing, without much differentiation. Insurance executives, investors, buyers, vendors and regulators will need more accurate measures of carrier performance that pinpoint insurance company operational efficiency and effectiveness. In literal terms, how much “bang for the buck” each carrier gets from its investment in operations. In the past, over reliance on financial strength measures as the gage of success has led to surprise liquidations and impairments of carriers at the time of cycle swings.
Carriers have three clear alternatives for navigating the current industry landscape. These are:
- Do Nothing (Ride the Wave)
- Hunker Down (Reduce Costs)
- Manage Through the Challenge (Create/Identify Opportunities)
- New Offerings
- New Customer Segments
- New Value Proposition
- New Uses for Capital
Winning in today’s P/C environment requires doing something. Any of these alternatives or combinations of them can be successfully used by carriers to out-perform competitors during the next stage of this unusual cycle depending on the carrier’s current situation and capabilities. Not all insurers are equal in terms of its capital, mix of business, scope of operations, distribution structure, etc. Management must know the strengths and weaknesses of the organization, and how they scale within the organization, before decisions about the best strategic approach for responding to this stage of the cycle can be determined.
It isn’t enough for management to know that business segment “A” performs better than business segment “B.” Rather they must know how these businesses perform against specific competitors and the overall industry, including the degree to which they lead or lag. If a company’s top performing line of business is lagging behind the industry’s best carriers, maintaining the status quo might not be the best option. Reinventing a weaker business in a segment without exceptionally strong competition could be a better choice.
Ultimately, management should think of their situation and the options available to them along two basic parameters, efficiency and effectiveness.
Knowing exactly where the company is positioned, internally and competitively, provides a foundation for evaluating the impact of a continuing soft cycle. Further, knowing the degree to which the company is strong or weak in various business lines provides a gauge of how significant a market challenge it can withstand better informing when to change course, amongst other decisions.
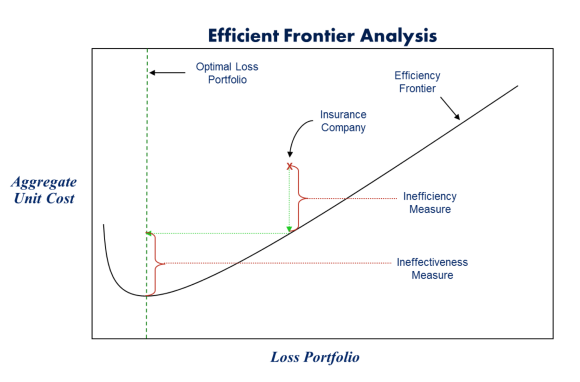
Efficient Frontier Analysis
Efficient Frontier Analytics (EFA) are an excellent tool for identifying where a carrier stands in the industry and relative to its competitors, as well as, which components of its internal operations (lines of business, resource categories, functions, etc.) are contributing to or detracting from the company’s success.
When properly applied, EFA can identify with a high degree of precision where a carrier is and is not operationally efficient and effective, including the degree to which it is or isn’t, in dollars. With such measures, management can have greater confidence in selecting strategies and tactics to address cycle changes. Knowing the value to be gained by implementing changes designed to outperforming competitors, puts the costs of doing so in context.
The answer for P/C carriers is to incorporate EFA tools into their planning and monitoring to better measure operational performance thereby having the flexibility to act/react when markets change.
Was this article valuable?
Here are more articles you may enjoy.
 Commercial Lines Rates Continue to Soften, Says Ivans Index
  NFL’s Rooney Rule Meets Biggest Challenge in Trump’s DEI Crackdown
  Allstate Q1 Net Income Skyrockets on Underwriting Gains
 From This Issue
