
Executive summary: Climate change, caused by human activity, is already leading to an increase in the frequency and severity of hot extremes, including heatwaves. While it is difficult to ascribe any given event to climate change, Moody’s RMS says, extreme event attribution studies that combine statistical analyses of observational data with multiple climate simulations can assess the influence of climate change. See below for an analysis of heatwaves’ link to anthropogenic climate change, originally published as a blog by Moody’s RMS.
Numerous headline-grabbing extreme events, and in particular heatwaves, have impacted the globe during the first half of 2023.
And for July 2023, preliminary data has indicated that the planet experienced its hottest week and month since the beginning of the instrumental record, and thus, most likely, its warmest in millennia.
The World Meteorological Organization (WMO) has announced the confirmation from the Copernicus Climate Change Service (C3S) that July 2023 was 0.72 degrees Celsius warmer than the 1991-2020 average for July, and 0.33 degrees Celsius warmer than the previous warmest month, July 2019.
Ongoing heatwaves have impacted the southern United States, Mexico, southern Europe and China, where high-pressure anticyclone ‘heat domes’ have developed, creating stable conditions with relatively clear skies that allow heat to accumulate in the lower atmosphere.
Record-Breaking Temperatures
All-time high temperature records have been widely established. In China, a new nationwide record of 52.2 degrees Celsius (126 degrees Fahrenheit) was reached on July 13.
In Southern Europe, many locations have also broken temperature records. On July 19, multiple locations ranging from southern Spain (Malaga), Sardinia (Decimomannu), and Albania (Durrës) all broke local records (46.2 degrees Celsius, 44.2 degrees Celsius, and 40.4 degrees Celsius, respectively).
In the United States, the city of Phoenix in Arizona saw temperatures above 43.3 degrees Celsius (110 degrees Fahrenheit) for a record 31 consecutive days covering the whole of July.
Around 190 million U.S. residents were put under heat advisory alerts in July, leading electricity grid operators to issue capacity alerts and potential blackout warnings.
Across Europe, the widespread heatwave conditions have already led to thousands of heat-related illness cases, and at least five deaths on construction sites across Italy. Leading trade unions have called for the implementation of work bans above certain temperature thresholds.
The overall death toll can be expected to be in the thousands but will only be known when actual mortality data can be compared with average summer death rates.
In Mediterranean countries, the impacts of the current heatwave are compounded by persistent drought conditions.
Significant wildfires have erupted across Greece, Italy, Croatia, Portugal, and Algeria, which have led to fatalities, wide-ranging evacuations, airport closures and potentially long-lasting impacts on tourism-dependent economies.
Heatwaves and Climate Change Attribution
Anthropogenic climate change has already led to an increase in the frequency and severity of hot extremes, including heatwaves (IPCC, 2021).
Although ascribing any given event to climate change is difficult, extreme event attribution studies combine statistical analyses of observational data with multiple climate simulations (run with or without historical greenhouse gas emissions) to assess the influence of climate change on their likelihood.
Due to rapid advances in climate modeling and the increased availability of observational datasets, attribution research has grown rapidly over the last two decades, and more than 500 extreme events have been assessed under this lens.
The approach has been successful with heatwaves, due to their direct link to the robust temperature signal.
A few examples include:
- 2003 European Heatwave: Anthropogenic climate change doubled the risk of a heatwave of this magnitude (Stott et al. 2004), which led to 70,000 excess deaths, mostly in France and Italy (Robine et al. 2008).
- 2010 Northern Hemisphere Heatwave: The event impacted Russia and central Asia (with nine million hectares of crop failures and 55,000 excess deaths). It was estimated to have been made three times more likely under climate change conditions (Otto et al. 2012).
- 2018 British Isles Heatwave: A study by the U.K. Meteorological Office found that the heatwave was 30 times more likely to have occurred now than before the Industrial Revolution, going from a 0.4 percent occurrence probability in any given year to 12.3 percent at present (McCarthy et al. 2019).
- 2021 Western North America Heatwave: The event, which led to hundreds of deaths, extensive marine life mortality and subsequent wildfires, floods, and landslides (from glacier melt), was given a first-order occurrence probability of 0.1 percent under current climate conditions, which was found to be at least 150 times higher than under pre-industrial conditions (Philip et al. 2022).
While no formal attribution study has yet been published on the current Mediterranean heatwave, quick-fire analyses based on existing peer-reviewed methodologies have indicated that the event could have been made at least 1,000 times more likely due to climate change (Zachariah et al. 2023).
Similar analyses for a previous heatwave episode in April 2023 found that it had been made 100 times more likely by anthropogenic climate change, and that it would have been extremely unlikely to have occurred without it (with a 40,000-year return period) (Philip et al. 2023).
However, there are limitations to the field of attribution, as long time series are required to generate robust statistics.
Also, as the analysis depends on the ability of climate models to reliably capture their behavior at relevant spatial scales, some perils such as extreme precipitation, tornadoes, and floods, remain very challenging to assess (Clarke et al. 2022).
Those limitations can become increasingly constraining as the probability of extreme events shift further away from pre-industrial conditions, leading to large uncertainties in attribution analyses.
Assessing Heat Stress Risk Impacts
The risk engine within the latest Moody’s RMS Climate on Demand Pro solution provides a forward-looking assessment of physical climate risk and its associated financial impacts (average damage and variability) for a wide range of perils (heat stress, wildfires, tropical cyclones, coastal and riverine floods, water stress and earthquake).
Results can be provided at the location level or aggregated at a portfolio level, thereby accounting for diversification of impacts to affected properties.
The datasets have been generated from decades of Moody’s RMS experience in developing stochastic physical risk financial impact models, and the risk-based output makes it possible to sum results from multiple properties, locations or perils.
Impact of Heat Stress
Within the Climate on Demand Pro solution, the impact of heat stress conditions on worker productivity is considered across a wide range of economic activities. The model, which leverages state-of-the-art climate model output, expresses the hazard in terms of “wet bulb temperature.” (Editor’s note: According to the National Weather Service, “A wet bulb measures the temperature read by a thermometer covered in a wet cloth. As water evaporates from the cloth, evaporation cools the thermometer. This mirrors how the human body cools itself with sweat.”)
This quantity, which is used in leading occupational health and safety assessments, more accurately reflects the risk, i.e., the impact of heat stress on the human body, as it also considers relative humidity and its impact on evaporative cooling.
The solution also considers the likelihood of installed air conditioning, and quantifies the impact of the thermal inertia of structures and of the altered land cover in urban surfaces, a phenomenon known as the “urban heat island (UHI) effect.”
The evolution of heat stress yearly occurrences in four selected cities recently exposed to heatwave conditions is considered in Figures 1 and 2.
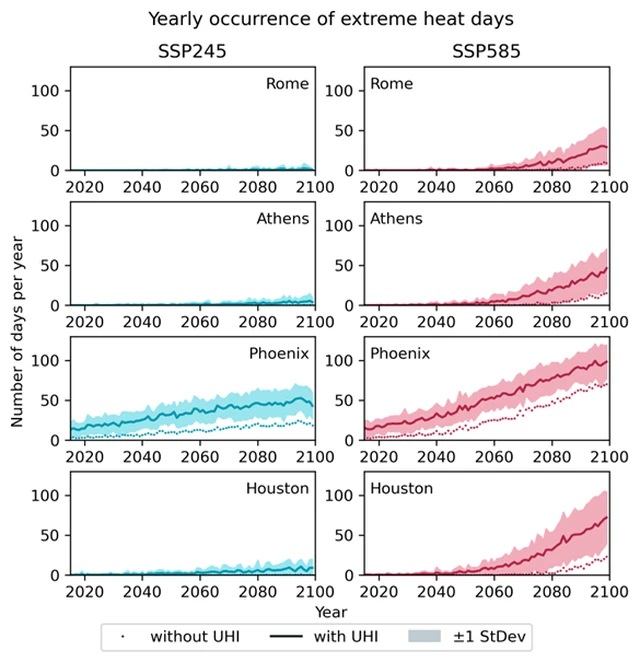
The figures focus on two severity thresholds representing “severe” and “extreme” impacts on human life and health, with wet-bulb temperatures over 26 degrees Celsius and 31 degrees Celsius, respectively, across cities in southern Europe (Rome, Athens) and in the southern U.S. (Phoenix, Houston).
Human beings can endure maximum wet-bulb temperatures in the range of 31 degrees Celsius to 35 degrees Celsius, with recent studies pointing towards the lower end of this range (Vecellio et al. 2022).
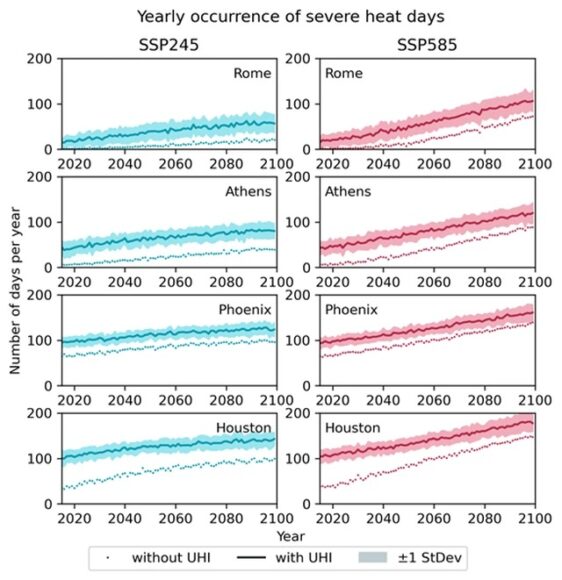
Projections are based on a 28-member ensemble of climate model output, showing the multi-model ensemble mean with (lines) and without (dots) urban heat island impacts. The shaded region encompasses one standard deviation around the ensemble mean. Editor’s note: Shared Socioeconomic Pathways (SSP) are used to derive greenhouse gas emissions scenarios under different climate policies.
Output from the Coupled Model Intercomparison Project Phase 6 (CMIP6) (Eyring et al. 2016) is used, under two scenarios for the twenty-first century (SSP245 – medium emissions; SSP585 – very high emissions).
The number of days under severe heat stress is shown to increase at all four locations (Figure 1), roughly doubling by mid-century for the Mediterranean cities.
A growing divergence in impacts is observed between the two scenarios from 2050 onwards, particularly for the number of extreme heat days (Figure 2), with the emergence of recurrent extreme conditions in the second half of the century under the high-emissions scenario.
The severe heatwaves currently impacting regions across the Northern hemisphere have resulted in peak observed wet-bulb temperatures of around 26 to 29 degrees Celsius in Italy[1] and above 30 degrees Celsius[2] in the southern U.S.
Those extreme conditions are captured in our model and can be turned into relevant impact estimates, as our framework tracks key variables directly linked to the biological consequences of heat stress.
The emergence of dangerous heat stress conditions around the globe under different climate change scenarios can thus be consistently forecasted.
References:
- Clarke, B., F. Otto, R. Stuart-Smith, and L. Harrington (2022). Extreme weather impacts of climate change: an attribution perspective, Environmental Research: Climate, 1, 012001, https://doi.org/10.1088/2752-5295/ac6e7d.
- Eyring, V., S. Bony, G.A. Meehl, C.A. Senior, B. Stevens, R.J. Stouffer, and K.E. Taylor (2016). Overview of the Coupled Model Intercomparison Project Phase 6 (CMIP6) experimental design and organization. Geoscientific Model Development, 9(5), 1937-1958, https://doi.og/10.5194/gmd-9-1937-2016.
- IPCC (2021). Climate Change 2021: The Physical Science Basis. Contribution of Working Group I to the Sixth Assessment Report of the Intergovernmental Panel on Climate Change [Masson-Delmotte, V., P. Zhai, A. Pirani, S.L. Connors, C. Péan, S. Berger, N. Caud, Y. Chen, L. Goldfarb, M.I. Gomis, M. Huang, K. Leitzell, E. Lonnoy, J.B.R. Matthews, T.K. Maycock, T. Waterfield, O. Yelekçi, R. Yu, and B. Zhou (eds.)]. Cambridge University Press, Cambridge, United Kingdom and New York, NY, USA. https://doi:10.1017/9781009157896.
- McCarthy, M., N. Christidis, N. Dunstone, D. Fereday, G. Kay, A. Klein-Tank, J. Lowe, J. Petch, A. Scaife, and P. Stott (2019). Drivers of the UK summer heatwave of 2018, Weather, 74(11), 390-396, https://doi.org/10.1002/wea.3628.
- Otto, F.E.L., N. Massey, G.J. van Oldenborough, R.G. Jones and M.R. Allen (2012). Reconciling two approaches to attribution of the 2010 Russian heat wave, Geophysical Research Letters, 39(4), L04702, https://doi.org/10.1029/2011GL050422.
- Philip, S.Y., S.F. Kew, G.J. van Oldenborgh, F.S. Anslow, S.I. Seneviratne, R. Vautard, D. Coumou, K.L. Ebi, J. Arrighi, R. Singh, M. van Aalst, C.P. Marghidan, M. Wehner, W. Yang, S. Li, D.L. Schumacher, M. Hauser, R. Bonnet, L.N. Luu, F. Lehner, N. Gillett, J.S. Tradowsky, G.A. Vecchi, C. Rodell, R.B. Stull, R. Howard, and F.E.L. Otto (2022). Rapid attribution analysis of the extraordinary heat wave on the Pacific coast of the US and Canada in June 2021, Earth System Dynamics, 13, 1689-1713, https://doi.org/10.5194/esd-13-1689-2022.
- Philip, S. ,S. Kew, R. Vautard, I. Pinto, M. Valhberg, R. Singh, F. Driouech, R. Lguensat, C. Barnes, and F.E.L. Otto (2023). Extreme April heat in Spain, Portugal, Morocco and Algeria almost impossible without climate change, https://doi.org/10.25561/103833.
- Robine, J.-M., S.L.K. Cheung, S. Le Roy, H. Van Oyen, C. Griffiths, J.-P. Michel, and F.R. Herrmann (2008). Death toll exceeded 70,000 in Europe during the summer of 2003, C. R. Biologies, 331, 171-178, https://doi.org/10.1016/j.crvi.2007.12.001.
- Stott, P.A., D. A. Stone, and M.R. Allen (2004). Human contribution to the European heatwave of 2003, Nature, 432, 610-614, https://doi.org/10.1038/nature03089.
- Vecellio, D.J., S.T. Wolf, R.M. Cottle, and W.L. Kenney (2022). Evaluating the 35°C wet-bulb temperature adaptability threshold for young, healthy subjects (PSU HEAT Project), Journal of Applied Physiology, 132(2), 340-345, https://doi.org/10.1152/japplphysiol.00738.2021.
- World Meteorological Organization (2023). WMO Global Annual to Decadal Climate Update – Target Years: 2023 and 2023-2027. 24 pp., https://doi.org/10.18356/9789210027939.
- Zachariah, M., S. Philip, I. Pinto, M. Valhberg, R. Singh, J. Arrighi, C. Barnes, and F.E.L. Otto (2023). Extreme heat in North America, Europe and China in July 2023 made much more likely by climate change, https://doi.org/10.25561/105549.
- [1] For weather stations around Rome (Italy), measured on 18 July 2023.
- [2] For weather stations around Houston (Texas) and New Orleans (Louisiana), over July 24-31 2023.
Was this article valuable?
Here are more articles you may enjoy.
 AIG’s Zaffino: Outcomes From AI Use Went From ‘Aspirational’ to ‘Beyond Expectations’
  What Analysts Are Saying About the 2026 P/C Insurance Market
  A 10-Year Wait for Autonomous Vehicles to Impact Insurers, Says Fitch