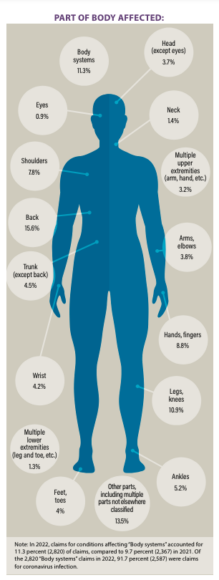
Oregon’s Department of Consumer and Business Services received notification of 24,947 accepted disabling claims for occupational injuries and diseases in 2022, according to a new report looking back on data from the year.
Employment increased by 71,100 workers and claims rose slightly from 2021, resulting in a 2022 claims rate of 1.3 claims per 100 workers. That rate equaled 2021, but it was up from 1.1 claims per 100 workers that’s held steady dating back to 2013, according to the department’s report.
The 30 fatalities reported in 2022 were the lowest number since 2013, down markedly from the workplace fatalities reported in 2021.
 Healthcare (16.1%) was the state’s top industry for percentage of claims. State and local government (14.6%), manufacturing (12%), transport and warehousing (11.3%), retail trade (10.8%) and construction (8.2%) were other top industries.
The most common claim characteristics included sprains, strains, tears (50.1%); fractures (9.5%); bruises, contusions (8.6%); multiple injuries (4.2%); and cuts, lacerations (3.8%).
The most common events that resulted in reported claims were:
- Overexertion (5,402 claims) (21.7%)
- Struck by or against (3,621 claims) (14.5%)
- Fall on same level (3,036 claims) (12.2%)
- Exposure to other harmful substances (2,762 claims) (11.1%)
- Bodily reaction (2,223 claims) (8.9%)
- Fall to lower level (1,269 claims) (5.5%)
- Transportation accident (961 claims) (5.1%)
- Slip, trip without fall (908 claims) (3.9%)
- Repetitive motion (871 claims) (3.6%)
- Caught in or crushed by (821 claims) (3.5%)
The most commonly injured worker occupation was transportation and material movers, comprising roughly 19.2% of all accepted disabling claims in 2022. Occupational diseases comprised 13.6% of the accepted disabling claims, the report shows.
Was this article valuable?
Here are more articles you may enjoy.


 Allstate CEO Wilson Takes on Affordability Issue During Earnings Call
  ‘Structural Shift’ Occurring in California Surplus Lines
  BMW Recalls Hundreds of Thousands of Cars Over Fire Risk
  Nine-Month 2025 Results Show P/C Underwriting Gain Skyrocketed

